


If you are looking for ways to improve the efficiency, safety, and longevity of your fleet, effective fleet management is highly recommended to achieve these goals. Key performance indicators (KPIs) are great ways to keep your business up to date and track progress throughout the year.
Monitoring your fleet and driver performance KPIs has several benefits for your fleet, including identifying unusual vehicle use, spotting potential safety issues, and creating cost efficiencies. These are the reasons why fleet managers are encouraged to track fleet KPIs, and the metrics listed below can serve as a guide:
Fleet Asset Utilisation Rate
It is said that setting challenging objectives for fleet asset utilisation and reducing downtime will put you on a strong path to success. You have the best chances of achieving these goals if the fleet vehicles are in excellent mechanical condition. It would be wise to have this utilisation metric set to 95%.
To calculate your fleet productivity, use this formula:
(Total Hours Worked) / (Work Hours less Lunch, Breaks or Meetings, Downtime like traffic) = Productivity Score
How to calculate fleet productivity
Target active fleet use rate: 95%
Fleet productivity score formula:
(Total hours worked) / Work hours – Downtime) = Productivity score
Preventative Maintenance Frequency
Scheduling and completing vehicle maintenance requirements on time, these are critical to keeping your fleet safe and running smoothly. Preventive Maintenance Services (PM) logs are key to various compliance requirements. A formal vehicle maintenance and safety policy can provide confidence about when it is time to schedule vehicles for maintenance, such as oil changes, maintenance, braking, and tire changes. Predictive maintenance helps reduce vehicle wear and tear and reduces the likelihood of major breakdowns and repairs.
Fleet managers can promote efficiency by establishing rules and guidelines.
- To avoid warranty problems and mechanical failure, require that vehicles be serviced using manufacturer-approved parts and at designated service locations.
- Standardize pricing, authorisation levels, and policies for emergency reimbursement. It increases employee’s trust and gives them the freedom to decide what’s best for their vehicle.
- Clearly state whether maintenance is planned based on mileage, time, or both. Encourage your drivers to schedule maintenance in advance to minimise disruption.
Efficiency and Productivity Ratings for Maintenance Technicians
It’s important to balance the size of your fleet maintenance team against the maintenance and repair needs of your vehicle and equipment inventory. It is recommended to staff your team with technicians that understand the modern heavy- or light-duty vehicle maintenance requirements and electronics.
Percentage of Repeat Repairs
Is your fleet service centre keeping track of the recurrent repairs you make to the same vehicle? Are comparable vehicles off the road due to frequent mechanical issues? Less than 3% of repairs should be repeated, ideally. Check for vehicle recalls if your number is higher, or ask the mechanics what parts and procedures they used to get the higher number.

Planned Maintenance and Repair Work
This metric supports your PM objective. The scheduled work objective ought to be 60% to run a fleet successfully. Look at your PM metrics if you are seeing an increase in unplanned repairs. Be on the lookout for ways to improve your interactions with your drivers or clients, such as giving more thorough directions or checking in more frequently. The risk of neglecting essential maintenance tasks and necessitating costly repairs is reduced by scheduled maintenance appointments.
Parts Availability
If you can manage them, contract out your parts inventory management procedures. In-house inventory is expensive to maintain, and unused parts may become outdated. Not only will outsourcing improve the availability of your parts, but it can also be a wise financial decision. Parts distribution and storage fees can be covered by independent companies. Without having to pay separately, you can always ask them to increase their inventory.
The ideal metric for this objective is to have 80% of the parts in stock, 90% available within two hours, and 98 % available within one day.
Idling Time
Unexpectedly long periods of idle time are sometimes left by drivers. You can increase fuel efficiency while minimizing the carbon footprint of your company vehicles by reducing excessive idling. On the other hand, poor tracking of idle time lowers your ROI.
Vehicle Maintenance Completion Rate
To set reasonable expectations, you should evaluate maintenance downtime on a per-class basis, such as specialty utilities versus passenger cars. Additionally, some vehicles would need to leave more quickly than others, such as patrol cars.
Ideally, your target metric should be to complete 90% of maintenance work within 48 hours. Vehicles requiring more complicated repairs ought to be taken to a licensed dealer service facility.
Customer and Employee Satisfaction
Maintaining high customer satisfaction scores and conducting surveys can help catch and address lingering issues. What tools are you using to monitor and understand your customer satisfaction rate? Have you thought about conducting online or phone surveys? To run a successful fleet, it is recommended to aim for a 90% customer satisfaction rate. Driver-employee satisfaction is similar to this.

Operations and Maintenance Cost Per Km
Due to the wide variety of vehicles and fuel types, maintenance and repair costs for utes and cars can vary greatly. The more kilometres vehicles are driven, the lower cost per km should be. Tracking your cost per km on a per-class basis. Look out for anomalies, and continuously track and improve this metric over time. Your collected data will help you keep records of these measurements and help improve your cost per kilometre over time. You might also want to think about including the total cost of ownership in your goals.
There are numerous fleet performance metrics to monitor, and it isn’t always simple to collect the information required to produce an accurate report for each metric.
By establishing fleet efficiency goals and metrics that are Specific, Measurable, Achievable, Relevant, and Time-Bound (SMART), you might achieve the industry’s best practices.
Disclaimer: It is important to note that the information in this document is authentic to the best of our knowledge, and as such, it is prone to errors and the absence of some key information. We can edit or change this appropriately to give the reader of this document updated industry-related information. Further, this information is for entertainment and informative purposes not to be perceived as professional advice with regards to health, finances, or any other field.
Products
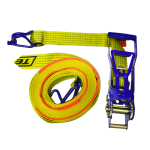
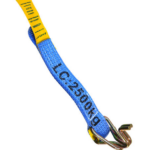
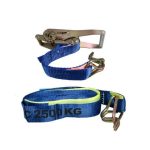
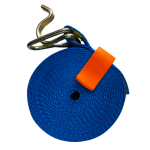
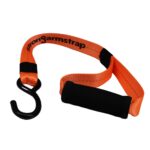
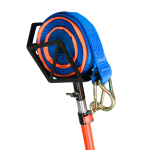
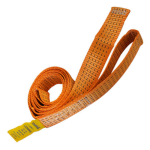
Wheel Clamp Replacement Strap – 3m x 50mm x 1750kg
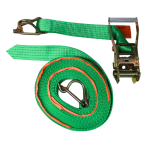
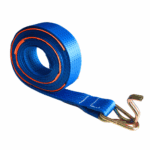
Wheel Harness Ratchet Tie Down – 1.5m x 50mm x 550kg
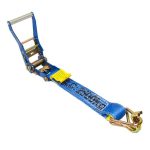
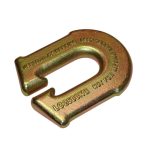
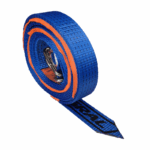
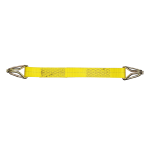
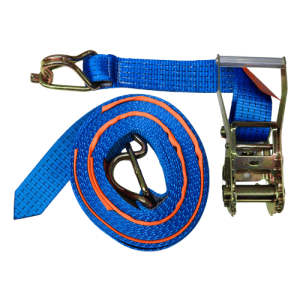
Wheel Clamp Replacement Strap – 2.6m x 50mm x 2500kg (200mm Loop)

250mm x 250mm Dangerous Goods Labels – Limited Quantity Classes
$0.75 - $1.00$0.75 - $1.00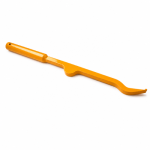
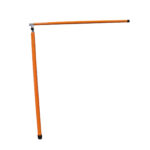
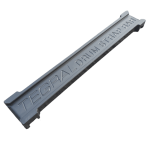
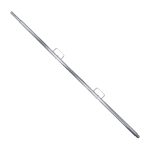
Shoring Bar Removal Tool – 370mm
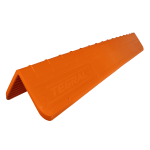
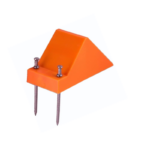
Peaked Curved Angle
$15.00 ex GST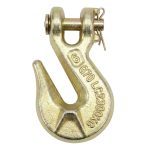
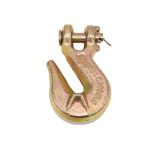
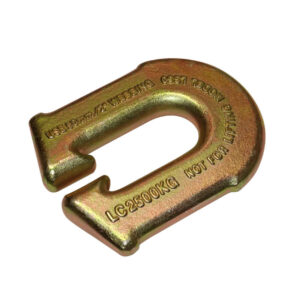
G70 Grab Hook 6mm – Clevis
$4.50 ex GST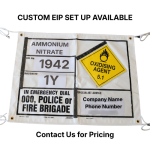
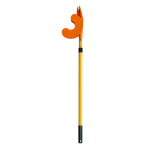
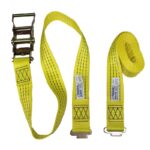
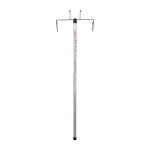
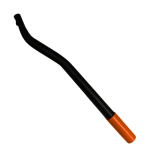
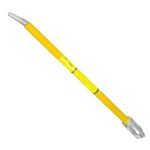
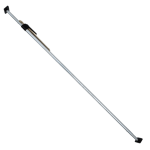
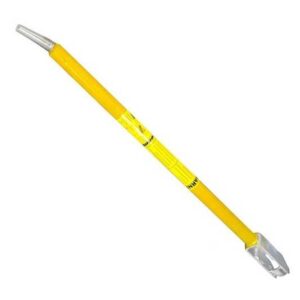
Strap Launcher
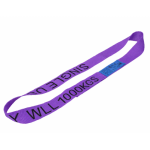
Round Single Use Sling 1T x 1.5m
$8.50 ex GST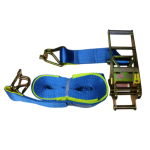

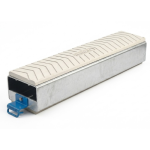
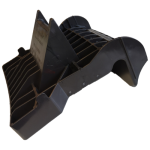
Dangerous Goods Segregation Box – Type II
$3,720.40 ex GST
Mini Container Bolt Seal (Domestic Use)
$0.66 ex GST